| June 2007 Index | Home Page |
About the Author: This article studies the role of technology in learning English as a Second Language in a new state-of-the-art university in Saudi Arabia. It finds different perceptions of learning technologies for students as they gain greater proficiency in the English language.
Using English Language Learner Perceptions of Technology to your Advantage
How student perceptions of instructional technology
at a new university guide their instruction
Jonathan Jacob Doll
Saudi Arabia
Since the advent of the modern computer, English as a Second Language (ESL) learning has shifted into high gear as the availability for teaching, re-teaching, vocabulary training, grammar building, and many other areas are all at the teacher’s fingertips. More importantly, these incredible insights are also at student’s fingertips in both learning labs and their usage of instructional technology in and out of the classroom. Still, the question of a students preconceived notions of technology – i.e. their perceptions – can have a lot to do with the eventual success or failures of its use in the classroom (Porter, 1999; Turner & Crews, 2005).
That said, a new university named Prince Mohammad Bin Fahd University opened in the eastern province of Saudi Arabia in Fall 2006 and wanted to make the fullest use possible of the instructional technologies that were available. Offering a cadre of engineering, business, and technology related programs to its students, the university had a majority of its students first enroll in a preparatory English program to improve their English skills. Thus, English was offered in a second-language-context by which students took three or more semesters of language-intensive classes before entering the university as a regular student. Also, the university was a picture of Middle Eastern opulence, with marble floors throughout, new classrooms with Smartboards, student labs, and software that make a new university state-of-the-art.
With four levels of English students (Beginner, Intermediate, Advanced, and Core), the author constructed a study to ascertain the student perceptions of technology at each English language level, thereby giving a window into the instructional preconceptions and needs of individual students. Coupled with that was a concern, prior to this research study, that teachers might misapply their emphasis on technology or not scaffold sufficiently for students who may not have previous experience or exposure to new forms of instructional technology.
Demographics
Table 1
Approximate Number of Students at PMU
Level | Males | Females |
0011/0021 | 35 | 35 |
0031/0041 | 180 | 210 |
0051/0061 | 50 | 50 |
Core | 55 | 55 |
Total | 320 | 350 |
PMU is only one of a handful of universities within Saudi Arabia that admit female students. So far, in its inaugural year, there are 670 students: 350 females and 320 males. Table 1 outlines which English programs these students are enrolled in, with the majority being intermediate students. PMU is a private university, but it also offers various scholarships so that its students are from varying socioeconomic groups.
Conceptual Framework
In order to effectively use instructional technology at a new university, a conceptual framework was developed (See Figure 1).
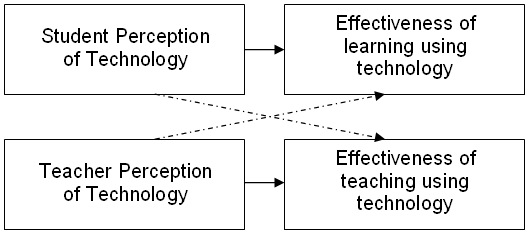
Figure 1: Conceptual framework for instructional technology perceptions
This framework drew upon the effective implementation of instructional technology at other universities and relied upon developing an understanding of the student and faculty perceptions of the various forms of instructional technology that were available to them (Indiana University School of Education, 2002; East Carolina University, 2007; Tuskegee University, 2007). This meant that we wanted to discern how amenable the students were at learning with technology and likewise how agreeable the faculty was in teaching with it. If students wanted to use instructional technology and were prepared for it, they might find greater success in using technology. Conversely, if teachers wanted to use instructional technology and were prepared for it, they might find greater success in using technology. In all, it was reasoned that if we could understand how agreeable students were with the use of technology, we could better inform how teachers used it in the classroom and how effective their implementation was.
Gender also may have played a role in student perceptions of technology. Numerous studies confirm this (Bame, Duger, deVries & McBee, 1993; Boser, Palmer & Daugherty, 1998; Comber, Colley, Hargreaves & Dorn, 1997; Teasedale & Lupart, 2001). Still, not all studies show that gender alone is significant in elucidating differences between student perceptions of technology. Davis and Davis (2007) found in a study of fifty-eight college students that differences in student perceptions were not significant based upon gender, although female students reported being more proficient with it. In order to follow up on these studies, the gender of students was concentrated on during this research study.
Research Questions
Initially, the author felt that university students might have held differing perceptions of technology based upon their culture of origin. Moreover, their English placement level was hypothesized as an indicator of technological preference. Thus, the research questions were as follows:
Do students of varying ethnicities and origins have differing perceptions of the use of instructional technology (IT was defined by the use of computers, laptops, Smartboard, videos, PowerPoint in instruction)?
Do students of varying ESL levels have perceptions of IT that are common to their level?
Could teachers, once made aware of the patterns in student IT perceptions, build on student interest when it is prevalent or be more knowledgeable of where IT implementation was not fully in place so as to scaffold the use of instructional technology as needed.
Methodology
With those questions in mind, a paper and pencil survey was created to determine how Spring 2007 students perceived the role of instructional technology in their learning of English, whether they liked it, and where they felt it could be improved (See Appendix A). In discussing the survey and how it was to be administered, teachers were guided in using the Majlis Method, where a teacher and the students discuss the meanings of each question and come to common meanings (Walters, Walters, Jendli, and Graber). The survey was given to the instructors of 670 students through the use of the inter-university email system. (A similar survey was administered to teachers, but it will not be discussed herein due to the small overall size of the faculty.)
There were fifteen questions on the survey. The first three were demographic, identifying location of origin, culture, and gender of the students. Questions four and five identified the students’ English program level. Questions six through ten identified students’ computer access at home and preferences regarding computer usage at home and at school. Questions eleven through fourteen were statements that used a Likert scale to rate how strongly students felt about technology being used in the English classroom. Finally, question fifteen was open-ended, and allowed students to identify additional ways that technology impacted them or how the school could improve its use of technology.
Results
From the 670 students in 18 classes, 313 surveys were returned by 187 male students (58%) and 126 female students (36%). Three were incomplete so that 310 surveys were used for this study. The survey was given during enrollment week when absence levels ran high. Distribution to teachers was not uniform because of the gender segregation of classes in much of the Middle East. The survey was given to male teachers during orientation, and sent by email to the women’s campus. IT staff are working on ways to make and send videos by email to all faculty members.
An analysis was conducted on the results of the 310 surveys using the SPSS statistical program. Each variables was looked at individually and some, collectively.
Demographics: origin and culture – The surveyed student body was surprisingly homogenous, with 288(93%) from Suadi Arabia, 15 (5%) from other Middle Eastern countries, and 7 (3%) from other areas including Europe, Asia, and the United States. Also, 288 (84%) were from cities of 5,000 or more people, while 48 (15%) were from smaller towns. As such, the picture of the students was overwhelmingly of Saudi Arabian descent, thus countering the research question which presumed that students had a significant degree of cultural difference. Also, these survey numbers mirror the demographics for the entire student body, which adds to the statistical validity for this study as will be discussed later.
English program level – As Figure 2 depicts, the number of surveyed Intermediate students swelled for both genders. Males were strongest in their representation as intermediate students, where 100 (54%) of their surveys were completed. Females had their strongest representation as core students, where 61 (48%) of their surveys were completed. Taken as a whole, all of the student English levels were represented by the completed surveys.
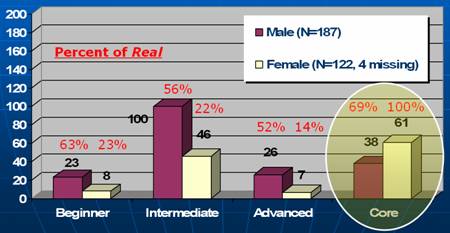
Figure 2: Student Levels Participating in the Study
Computer access at home and preferences therein – A stunning 97% of surveyed students had access to the internet, of which 58% was broadband and 39% was by a dialup service. In addition, over 90% of the students reported having a second computer at home, which strongly suggested that all would have access at home to various forms of instructional technology. 95% of surveyed students reported that they liked the use of Smartboards by their English teachers during instruction while a only 74% reported that they similarly liked to use their laptops as they learned English. Though the university requires students to have and use laptops, this also suggests that more scaffolding and facilitation in this process should be conducted by faculty members. Finally, since computer assisted learning (CAL) labs were still being built, students were asked if they would like to use them in the future to help them learn English. 75% of students who responded affirmed this idea, again suggesting that more scaffolding and facilitation of these labs would be beneficial. Gender did not play a significant role in student responses to these questions.
Technology in the English classroom – Likert scale responses on four survey questions ranged from strongly disagree to strongly agree. These four choices required students to voice their position rather than express no opinion at all. Interestingly, the idea of using such a scale was foreign to some of the students and required teachers to offer additional clarification. One student asked for his survey back after completing it, whereupon he switched all of his responses to the opposite end of the scale. When asked about it, he explained:
I change the answers from strongly disagree too strongly agree because I think the strongly disagree is the good and I asked Fawaz and he tell me u ronge [you wrong] and I ask Mr. Doll and I tell them I wont [want] my beber [paper] to change something and I changed these sit. Sorry about thes
(Personal communication, Mohannad Mahrous, February 28, 2007).
Statement 11: The teacher talking to the class helps me learn English.
On the teacher version of the survey, “talk to the class” was termed as the teacher “lecturing the class”. However, since the students represented several levels in an ESL environment and many would not understand the meaning and nuances of the term “lecture”, this word was broken down into simpler English. Here 92% of students affirmed the use of lecturing in a classroom context and male and female students showed agreement.
Statement 12: Discussion-style teaching class helps me learn English.
In contrast to the previous questions, the difference between lecturing and discussion was explained by the those administering the survey. This time, there was an even larger amount of agreement from students, with 94% of students affirming the use of classroom discussion.
Statement 13: The Smartboard helps me learn English.
Statements thirteen and fourteen were the most integral research questions set forth in this study. Interesting insights included differences between male and female responses. In statement thirteen, an average of 83% of students, 79% of males and 87% of females, responded that the Smartboard was helpful in their language instruction. There was also a further differentiation of student responses according to their English levels which will be discussed in the next section.
Statement 14: Other forms of technology (radio, CD, video, PowerPoint) help me learn English.
As with statement thirteen, male-female differences were also more pronounced, although the overall sense of agreement was stronger than in the previous question. An average of 91% of students, 86% of males and 95% of females, responded that other forms of technology were useful in their language instruction. This was particularly interesting because it gave a window to what things students wanted t at this new university.
Question 15: Open-ended response
In the short-answer responses, students shared the new forms of technology that they wanted to see. Among the lop-of-the-list items were movies, videos, and even some form of educational television. As has been noted elsewhere, students wanted to see teachers using technology more – a thing one might term as “speaking their language” (Prensky, 2001; Haynes, 2006).
Discussion
There was a widespread desire of students to see and use various forms of instructional technology in the classroom, as evidenced by responses to statements thirteen and fourteen as well as the open-ended responses in question fifteen. This inspired an extended Chi square analysis of questions thirteen and fourteen (the two Likert-scale questions created directly from the research questions) in order to further understand how students had responded.
Question number 13 dealt with the level to which students felt that the use of Smartboard technology helped them in learning English. In order to understand student responses, the data was analyzed to determine which students agreed with this question. In all, 253 (82%) of the students either agreed or strongly agreed with question 13 (See Table 2).
Table 2
Question 13 - Preference for Smartboard – agreed or strongly agreed
Question 13 | Beginners | Intermediates | Advanced | Core |
Number of students | 25 | 118 | 21 | 85 |
Percent of their level | 81% | 82% | 66% | 81% |
From crosstabs in SPSS, these students were found to be of a largely homogenous (by percentage) distribution of English levels, including 25 Beginners (81% of Beginners surveyed), 118 Intermediates (82% of Intermediates surveyed), 21 Advanced students (66% of Advanced students surveyed), and 85 Core students (81% of Core students surveyed). This led to the question about who were the concurring students, what characteristics did they have in common and how did they differ. For students who strongly agreed, the level of English was of interest (See Table 3).
Table 3
Question 13 - Preference for the Smartboard – strongly agreed only
Question 13 | Beginners | Intermediates | Advanced | Core |
Number of students | 14 | 43 | 5 | 19 |
Percent of their level | 45% | 30% | 16% | 19% |
The largest number of students who strongly advocated the use of the Smartboard were Beginners, with 45% of students in their level, followed by Intermediates, with 30% of students in their level. A chi square significance value of .013 was found for this variable when students expressed strong agreement. Then, the lowest scores for Smartboard use came from the Core students (19%) and lastly the Advanced students (16%). These results suggest that lower level English learners learn best from a visual, multimedia environment that the teacher as the ultimate manipulator and information-giver. Conversely, the higher level students were not as appreciative or not as dependent on a teacher-led multimedia environment. Surprisingly, this suggests that beginning and intermediate learners are closest in their preferred type of instruction to the teacher-led behaviorist style classes that are the norm in Saudi Arabian high schools.
Next to be studied was[FBW3] student preferences for other forms of technology, such as for radios, CDs, video and PowerPoint. More students responded in agreement or strong agreement than was observed in question 13. Table 4 records student responses that were in agreement or strong agreement. On question 14, the responses were even more homogenous (by percentage) in distribution of English levels, ranging from only 93% for beginners to 84% for advanced classes.
Table 4
Question 14 - Preference for other technology – agreed or strongly agreed
Question 14 | Beginners | Intermediates | Advanced | Core |
Number of students | 27 | 131 | 27 | 88 |
Percent of their level | 93% | 90% | 84% | 89% |
This showed that nearly all students, regardless of level, were in agreement to a large extent with the use of other forms of technology. A further look at these students selected only ones who had shown strong agreement (See Table 5). A chi square significance value of .021 was found for this variable when students expressed strong agreement. The largest group showing strong agreement was Core students at 46% of their cohort, closely followed by 40% of Intermediate students. Advanced and Beginning students trailed behind at 28% and 17% of their cohorts, respectively.
Table 5
Question 14 - Preference for other technology – strongly agreed only
Question 14 | Beginners | Intermediates | Advanced | Core |
Number of students | 5 | 58 | 9 | 46 |
Percent of their level | 17% | 40% | 28% | 46% |
These results taken individually might seem unimpressive, but taken together they show some common themes for each level of English language learners. In addition, themes can be drawn up for individual preferences for instructional technology shown by students at each level. Surveys by level for Question 13 suggest that Beginners and Intermediates most appreciate use of the Smartboard in their education while Advanced and Core students do not rely as heavily on it. One explanation for this is that these groups, who speak English at the most basic levels, appreciate a teacher-led multimedia curriculum the more than Advanced and Core students
Secondly, the breakdown from Question 14 suggests that Beginners and Advanced students may not be ready for new or alternative forms of instructional technology, whereas Intermediates are quite interested and Core students are the most interested in these options. The significant lack of interest by Beginners in new forms of technology might in-part be from their inexperience with such applications or in-part from lack of English skills. The lower interest from advanced students might be because these students are more focused on getting into the Core.
Conclusion
The first research questions for this study proposed that ethnicity would affect student perceptions of instructional technology. This proved to be false due to the student population being much more homogenous by ethnicity than anticipated. However, this research question deserves the accolade of having inspired the study. The second and third research questions turned out to be true. Thus, students of varying levels of English proficiency in English do have differing perceptions of the use of technology, and as a result teachers can redirect their focus in line with student needs when using various forms of instructional technology.
Based on these findings, faculty at our university can begin to streamline their education of students learning English and more appropriately respond to their English-level preferences for the use of Smartboards and other forms of technology. As a result, the Smartboard is used primarily with Beginner and Intermediate level students and can be tapered off or supplemented with PowerPoint and other types of instructional technology in the Advanced and Core levels. Similarly, other technology can be used with Intermediate and Core level students – those who are either insulated from the need to make a large step in their English level – while additional scaffolding and modeling can be used with Beginner and Core level students.
A secondary result of these findings could be that other universities in the Middle East and beyond can evaluate their uses of instructional technology based on the level of English of their students. Findings from other schools and universities might corroborate those at our university or challenge them. In either case, instructors have more definitive data on technologies to deliver educational programs for which students are ready and they perceive as effective.
References
Bame, A., Dugger, W. Jr., de Vries, M., & McBee, J. (1993). Pupils’ attitudes toward technology–PATT-USA. The Journal of Technology Studies, 19(1), pp. 40-48.
Boser, R. A., Palmer, J. D., & Daugherty, M. K. (1998, Fall). Students’ attitudes toward technology in selected technology education programs. Journal of Technology Education, 10(1), 4–18. Retrieved September 12, 2003, from http://scholar.lib.vt.edu/ejournals/JTE/.
Comber, C., Colley, A., Hargreaves, D. J., & Dorn, L. (1997, Summer). The effects of age, gender, and computer experiences upon computer attitudes. Education Research, 39(2), pp. 123–133.
Davis, J. & Davis, H. (2007). Perceptions of career and technology and training and development students regarding personal computer knowledge and skills. College Student Journal, 41(1), pp. 1-6.
East Carolina University. (2007). Conceptual framework for preparing education professionals. Retrieved on July 7, 2007 from the Internet at: http://www.ecu.edu/cs-educ/admin/ConceptualFramework.cfm.
Haynes, J. (December 2006). Circle time: DSL – Digital as a second language. The Essential Teacher, 3(4),pp. 6-7.
Indiana University School of Education. (2002). Conceptual framework: Commitment to technology. Retrieved on July 7, 2007 from the Internet at: www.indiana.edu/~iubncate/framework/technology.html.
Porter, S. (1999). Technology in teaching literature and culture: some reflections. University of Oxford. Retrieved on May 21, 2007 from the Internet at: http://users.ox.ac.uk/~ctitext2/publish/occas/eurolit/porter.html.
Prensky, M. (October 2001). Digital natives, digital immigrants. On the horizon. NCB University Press, 9(5), pp. 1-6. Retrieved on February 25, 2007 from the Internet at: http://www.marcprensky.com/writing/.
Teasdale, S., & Lupart, J. L. (2001). Gender differences in computer attitudes, skills, and perceived ability. Paper presented at the Canadian Society for Studies in Education, Quebec, Canada. Retrieved January 19, 2004, from http://www.geomatics.ucalgary.ca/cwse/CompAtt.pdf.
Turner, F. & Crews, J. (2005) Bricks and clicks: A comparative analysis of online and traditional education settings. International Journal of Instructional Technology and Distance Learning. 2(4), pp. 3-8.
Tuskegee University. (2007). The conceptual framework: Commitment to technology. Retrieved on July 7, 2007 from the Internet at: www.tuskegee.edu/global/story.asp?s=1211394&ClientType=Print
Walters, T. Walters, L., Jendli, A., Graber, G. (2006). Pain and delight: Social consequences of internet use in the United Arab Emirates. A podcast of a written presentation. Retrieved on May 9, 2007 from http://www.zu.ac.ae/podcast/mp3only.html.
About the Author
Jonathan Jacob Doll | Jonathan Jacob Doll, M.Ed. teaches intermediate- and advanced-level English at Prince Mohammad University (PMU). He is also a doctoral candidate at Texas A&M University in Curriculum and Instruction with an emphasis on ESL education. PMU first opened in 2006. This research study was presented originally at TESOL Arabia in Dubai, United Arab Emirates on February 22, 2007. Jonathan can be contacted by email at jdoll@pmu.edu.sa |

_____________________________________________________
APPENDIX A: STUDENT LEVEL SURVEY
1. Gender □ Male □ Female
2. Culture □ From Saudi Arabia
□ From Oman, Yemen, Bahrain, Qatar, or UAE
□ From another country in the Middle East or Africa
□ Other
3. What type of town or city are you from?
□ Small: 100 – 500 persons
□ Medium: 500 – 5,000 persons
□ Large: 5,000 or more people
4. Academic Level (Check only one) □ Preparation Year □ Core Curriculum
5. If Preparation Year: □ PRP 0011 □ PRP 0031 □ PRP 0051
6. Do you have a computer at home in addition to your school laptop?
□ No □Yes
7. What level of access to the Internet do you have?
□ No internet access □ Dialup access □ High speed access
8. Do you like the use of the Smartboard as you learn English?
□ No □Yes
9. Do you like to use your laptop in the classroom as you learn English?
□ No □Yes
10. Would you like to use computers in a computer lab as you learn English?
□ No □Yes
Tell whether you strongly agree, agree, disagree, or strongly disagree.
11. The teacher talking to the class helps me to learn English.
□ Strongly Disagree □ Disagree □ Agree □ Strongly agree
12. Classroom discussion between the teacher and students helps me
learn English.
□ Strongly Disagree □ Disagree □ Agree □ Strongly agree
13. The use of the Smartboard helps me learn English.
□ Strongly Disagree □ Disagree □ Agree □ Strongly agree
14. The use of other technology (radio, CD, video, or PowerPoint) helps me
learn English.
□ Strongly Disagree □ Disagree □ Agree □ Strongly agree
15. Do you have any additional thoughts about using technology in English
classes?
_____________________________________________________