Editor’s Note: Courses with strong visual, interactive, and decision making components make excellent online courses. This paper shares five years of experience in adapting a course – and online software – for a statistics course in economics. Its strengths as perceived by students are interactivity and online resources. Additional assistance and activities would further strengthen this course.
Learning Statistics in a Shared Virtual Campus. Summarizing a Five-Year Experience
Ana Jesús López and Rigoberto Pérez
Introduction
The development of Information and Communication Technologies (ICT) has introduced substantial social changes, including the dissemination of statistical information and teaching and learning methods. As a consequence, statistical courses can benefit greatly from the increasing availability of information, the use of statistical packages and the possibilities of Internet as a teaching tool.
In this paper we describe the on-line course “Economic Data Analysis” which is offered in the virtual campus of the University of Oviedo, AulaNet and also in the so-called G9 Shared Virtual Campus. The work contains a brief presentation of the learning method, describing the main teaching tools and the educational software ADE+. A “facts and figures” section is also included, summarizing our five-year experience with this on-line subject.
The paper ends with some concluding remarks and a list of bibliographical references.
Keywords: Statistics, Internet, ICT, e-Learning, AulaNet, G9 Shared Virtual Campus, Economic Data Analysis, educational software, ADE+, online polls, European Space for Higher Education.
1. Statistics in the Information Society
Information and Communication Technologies (ICT) have deeply affected the production, dissemination and treatment of statistical information. The Statistical Offices have played a fundamental role in this new situation, since their Internet servers provide fast access to vast amounts of information and resources thus becoming an increasingly popular way of finding statistical information.
In 1929 H.G. Wells predicted:
"The time may not be very remote when it will be understood that for complete initiation as an efficient citizen of one of the new great complex world wide states that are now developing, it is as necessary to be able to compute, to think in averages and maxima and minima, as it is now to be able to read and to write."
Today most people would agree with this thought since a certain statistical knowledge is required for the correct interpretation of daily economic information, such as the Consumer Price Index or the employment data. Furthermore, most students are bound to deal with statistical information in their professional future.
Teaching and learning methods have experienced substantial changes during the last years, while printed materials have progressively been complemented by audios, videos, computers and -more recently- digital technology.
In this gradual process Internet has introduced a wide variety of pedagogical resources, including the access to on-line teaching material (presentations, working papers, examples, links of interest, suggested activities, …) and also communication tools (e-mail, chats, forums, distribution lists, video-conferences,...). The efficient use of these facilities would introduce some outstanding advantages, including not only space and time flexibility but also increasing student interaction in the learning process.
The term E-learning means, according to the European Commission, "using new multimedia technologies and the Internet to improve the quality of learning.” In this context, teachers must face the challenge of using the ICT facilities for the development of high-quality educational materials, also improving the level of communication and satisfaction of teachers and students.
This paper describes our experience with the on-line course “Economic Data Analysis” (ADEnet), included in the virtual campus of the University of Oviedo and also in the Shared Virtual Campus developed by the G9 Group of universities.
Section 2 provides an overview of the course and its learning resources, while section 3 briefly describes the main characteristics of our software ADE+. The description of tutorials, communication facilities and evaluation is presented in section 4. Next, section 5 summarizes some of the most outstanding facts of our five-year experience, including information about student’s profiles, results and opinions. The paper ends with concluding remarks in Section 6.
2. Economic Data Analysis: Learning Resources
“Economic Data Analysis” is a practice-oriented subject, which has been designed considering the students as users of the statistical information and trying to make an efficient use of Information and Communication Technologies (ICT), mainly the Internet. This optional subject was launched in the course 1999/2000 and is currently offered in the Shared Virtual Campus developed by the G9 Group, which includes the universities of Cantabria, Castilla-La Mancha, Extremadura, Illes Balears, La Rioja, Pública de Navarra, Oviedo, País Vasco and Zaragoza.
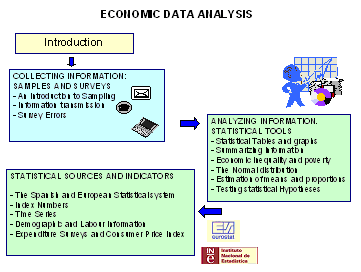
Figure 1. Economic Data Analysis - Course Syllabus
As figure 1 shows, the syllabus of this on-line course contains a three module classification, following the sequence of the origin, treatment and dissemination of statistics.
The first approach to each item is provided by a “virtual lesson”, designed as a twelve-minute multimedia presentation, offering an overview of its main contents. Afterwards students can access a wide variety of learning resources, including electronic books, dynamic presentations, interactive questions, figures, links, glossaries of terms, web references, self-assessments … The practical contents are based on the software ADE+, which is described in the next section.
The statistical websites play an important role in the course since they clearly show the ways of access and treatment of the economic information. Students are encouraged to become familiar with the main statistical servers, such as the Spanish National Statistical Institute, (http://www.ine.es), the European Office for Statistics Eurostat (http://europa.eu.int/comm/eurostat), United Nations (http://www.un.org) or the World Bank (http://www.worldbank.org).
With the aim of encouraging the participation of students, the course includes several interactive questions, which are easily corrected from the web allowing the students to check their level of knowledge. The critical perspective is emphasized through the inclusion of proposed questions. A “Statistical Mistakes” section is provided, showing some historical anecdotes and risks of statistical analysis.
As an example, let us consider the lesson studying the Inequality and Poverty Measurement. An easy introduction to this field is presented through the story of a wealthy family and its legacy distribution, analyzing the inequality degree related to different options.
The main concepts of this chapter (income and population shares, Lorenz curve, Gini index, inequality measures, poverty line, ...) are introduced with graphical assistance, also including many links to statistical websites as the United Nations, the World Bank or the Spanish National Statistical Institute (INE). In order to encourage their participation, students are asked about the expected impact on inequality of some distributive policies such as proportional taxes or income transfers, whose effects are graphically displayed through animated presentations.
The chapter ends with some considerations about poverty, including a brief report on the 1998 Nobel laureate in Economics, Amartya Sen, summarizing his contributions to the measurement of inequality and poverty.
Once the lesson is finished, a self-assessment is suggested. In this option a battery of questions is randomly selected and corrected from the web, the student marks being transferred to the subject’s database in AulaNet.
3. The Software Ade+
Following the “learning by doing” approach, the practical contents of “Economic Data Analysis” are based on the software ADE+, specifically developed for teaching purposes. This application has been developed and registered by R. Pérez and A.J. López (license 1996/33/27694 of the Intelectual Property Provincial Register of Asturias) and is available from the AulaNet website: http://www.aulanet.uniovi.es/ade+/.
Although there is a wide variety of available statistical packages, suitable software for teaching purposes is not always easy to find, especially for introductory courses.
On the other hand, the use of professional applications does not seem adequate since most packages become self-sufficient, leading users to adopt a passive role and restricting their learning potential. One solution commonly adopted to promote participation of students in the practical sessions of Statistics is the use of spreadsheets. According to our experience, this option has some advantages:
Spreadsheets are user-friendly tools
Many statistical offices and institutions provide excel workfiles which can be easily downloaded from their Internet servers
Students are allowed to gradually build the required operations
Results can be automatically updated
Nevertheless, we have also detected some important objections related to the educational use of the spreadsheets:
Statistical functions and commands are not always correctly defined
Spreadsheets do not usually provide options which are commonly used in economic statistics, such as index numbers or rates of growth.
These disadvantages have suggested the development of didactical software which is usually included in some statistics textbooks and/or available in Internet. In fact this was also the motivation behind the software ADE+ which aims to support interactive data analysis, allowing the students to build and analyze their data sets.
As it is shown in figure 2, ADE+ is organized in three different areas: a text editor, a spreadsheet-like data table and an object container. This structure allows a comprehensive treatment of the statistical information, including data collection, graphical representations, statistical analysis and interpretation of results.
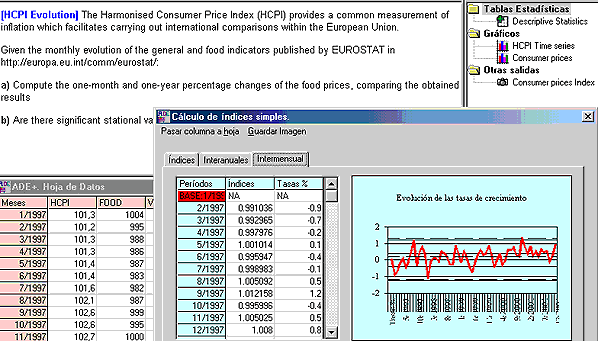
Figure 2. The ADE+ Software
A wide variety of statistical options is available from the menu, including sampling, data tabulation and representation, descriptive statistics, joint analysis, index numbers, time series, probability distributions and statistical inference.
As Pérez & López (2003) state, the use of the ADE+ software has proved to be satisfactory in both presential and virtual education. In the case of “Economic Data Analysis” the students can access a wide variety of workfiles with solved and proposed questions and also an online user guide explaining all the available facilities.
4. Tutorials, Communication and Evaluation
Although there is a general agreement about the e-learning potential, some risks have also been detected, mainly referring to the isolation of students. Therefore, the success of an on-line course depends to a great extent on its communication and evaluation facilities.
Some recent works find that the dialogue is more difficult when it is mediated by ICT, but at the same time the amount of dialogue can be greater in e-learning courses than in traditional ones. In the case of our course “Economic Data Analysis” dialogue is strongly encouraged and therefore tutorials are provided in several ways, including e-mail, chats, forums and video-conferences.
On-line assistance connects students with their tutors, providing quick answers (within 24 hours) to their questions and comments through e-mail. This option is widely used by students together with a shared board conceived as a permanent forum. Both tools are based on asynchronous communication, allowing flexible participation of students any time they have a question.
Furthermore, students have access to a weekly chat, allowing synchronous discussion with classmates under the coordination of a teacher. For those preferring a face-to-face debate, video-conference tutorials are also available.
According to our experience, students attach great value to having access to personalized information. Therefore, confidential reports are available, providing indicators of the student’s progress (such as assessment results) and specific comments about their personal work.
The evaluation system of “Economic Data Analysis” has been designed trying to achieve coherence with the learning process. More specifically, the final grades are obtained according to the following criteria:
Self-assessment results (30%)
Marks of the personal work sent to tutors (30%)
Marks of the final on-line exam (30%)
Activity and participation Indicators (10%)
It must be noticed that the online evaluation is an outstanding characteristic of this subject, providing a distinctive feature from most virtual experiences.
Online evaluation of Economic Data Analysis is designed as a practical exam allowing students to show their ability in the use of statistical tools and the interpretation of economic indicators. A key element in this evaluation is ADE+, since students are requested to solve some problems with this software, the workfiles being self-stored and forwarded to the AulaNet platform.
As expected, the implementation of the online evaluation required special efforts in the context of the G9 Shared Virtual Campus, whose members have developed a coordinated strategy paying special attention to questions such as timetables, security conditions, student isolation or tutor accessibility.
Since students should have full academic recognition of the credits coursed at each of the universities included in the G9 Group, the success of the shared virtual campus needs great attention being paid to both technical and administrative aspects.
5. Facts and Figures
Our five-year experience with the subject “Economic Data Analysis” has provided some useful information about academic results and students´ opinions.
As can be seen in Figure 3, the number of students shows an increasing path both for the University of Oviedo and the other institutions included in the G9 Shared Virtual Campus.
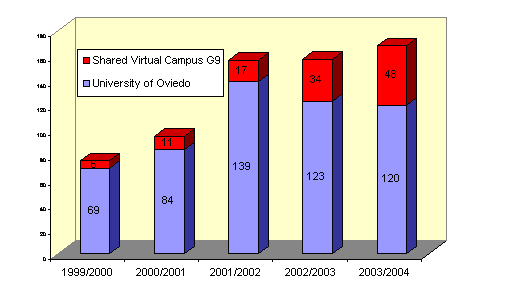
Figure 3. Evolution of Students in “Economic Data Analysis”
It must be stressed that the positive evolution of this subject refers not only to the increasing number of enrolled students but also, and most important, to their rate of participation in the course, which could be interpreted as the complementary of the percentage of desertion.
This is quite an interesting fact, since desertion has been identified as one of the most outstanding risks of the e-learning experiences. Although this fact could be the consequence of different factors (including the lack of information, technical difficulties or personal reasons) we have noticed that some of these problems can be avoided by making an extra effort to inform, to help and to encourage students in their learning process.
In order to collect the opinions of all the agents involved in the e-learning process, the coordinators of the G9 shared virtual campus have developed a wide variety of tools, including on-line surveys for students and teachers and also specific interviews for those students who have given up their virtual experiences. Furthermore, the annual meetings of the G9 Shared Virtual Campus provide teachers, students and administrators with an excellent opportunity for sharing their experiences.
According to the online surveys, the students of the G9 Shared Virtual Campus are mainly motivated by the use of new learning methods and their flexibility. As Salinas et al (2002) summarize, these students are connected to the Shared Virtual Campus an average of three hours per week, and most of them find that the university infrastructures do not satisfy the e-learning requirements.
According to their answers, the students find the learning materials as adequate or very adequate (82.6%) of a high quality and well structured (80.4%) and available in time (71.7%). Figure 4 represents the main results referring to the course “Economic Data Analysis” and to the G9 Shared Virtual Campus as a whole.
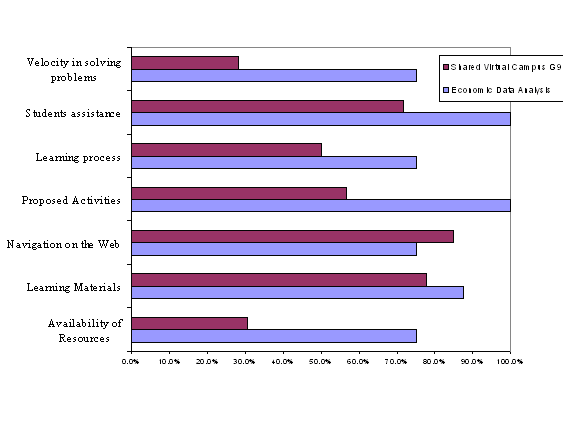
Figure 4. Student Online surveys: Proportion of answers
“Very Satisfactory” or “Satisfactory”
In the case of our course “Economic Data Analysis” students have repeatedly been interviewed about their experience, including technical questions, pedagogical aspects and specific educational tools. In general terms, the experience has been positively evaluated and the main results are summarized in Figure 5, where the average score assigned to each item (in a scale from 0 to 10) is represented together with the Pearson´s coefficient of variation.
| Average score | Pearson´s coefficient of variation |
Virtual Lessons | 6.73 | 29.2% |
Practical contents | 8.22 | 14.4% |
Software ADE+ | 7.51 | 20.5% |
Self-evaluation | 8.27 | 19.5% |
Interactive questions | 7.20 | 24.5% |
Tutorials | 7.81 | 30.1% |
Communication facilites (forum, chat, …) | 4.14 | 72.8% |
Figure 5. “Economic Data Analysis“:
Results of Students online surveys
In general terms, the best scores are related to the most participative tools, such as self-assessments, interactive questions or practical contents solved with ADE+.
Although the students also appreciate the personal assistance and tutorials, the use of communication tools (chat, forum, video-conference, ...) has obtained lower average scores with high relative dispersion. This lack of representativeness shows the existence of two different groups of students with active and passive behaviours.
Technical difficulties and low speed or the network remain as the most negative aspects, although a considerable improvement has been observed during the period.
Finally, it is important to stress that once the students have became familiar with these new learning methods and experienced their advantages, most of them are highly interested in further e-learning experiences.
6. Concluding Remarks
The development of the Information Society has led us to a new educational context, in which students can learn statistics in a more realistic, flexible and participative way. Our five-year experience with the online subject Economic Data Analysis has been satisfactory for both students and teachers, showing the didactical power of Internet and allowing the implementation of multimedia educational material (MEM), links to statistical servers, self-assessments and an on-line examination.
The use of the statistical software ADE+, specifically developed for teaching purposes, has shown many advantages since it allows students to easily access and analyze economic information.
The described experience could be helpful in the design of new e-learning courses, based on multimedia technology and pedagogy-oriented. Furthermore, since e-learning stimulates exchanges and collaborations, the experience of the G9 Shared Virtual Campus could be successfully extended to other university groupings established in different spatial areas.
In the European context these strategies could contribute to the achievement of the Lisbon Summit (2000) strategic goal: “to make out of the European Union the world’s most competitive and dynamic knowledge-based economy, capable of sustainable economic growth and with more and better jobs and greater social cohesion”. In fact, the e-Learning initiative launched by the European Commission under the title “Designing tomorrow’s education” aims to create the appropriate conditions for the development of contents, services and learning environments, improving cooperation and dialogue at regional, national and European levels and between all the participants in the field (universities, schools, decision-makers, administrations, ...).
According to a recent study by PLS Ramboll (2004), most European universities show a positive attitude towards ICT integration and e-learning, although the support and priority allocated by university management is a critical obstacle in many of them.
This research distinguishes four university clusters, respectively defined as the front-runners (18%), the co-operating universities (33%), the self-sufficient (36%) and the sceptical (15%), concluding that most universities still face a severe challenge in terms of incorporating the results and experiences gained from development projects into their overall strategy.
Since we are now facing the Bologna process, with the aim of establishing a European Higher Education Area, in which staff and students can move with ease and have fair recognition of their qualifications, it seems quite clear that Information and Communication Technologies could be extremely helpful for the achievement of these goals. Therefore, we think it is time to share experiences, stimulate exchanges, facilitate interaction and collaboration and recognize our students as competent, active and constructive partners in higher education.
References
Behar, R. & Grima, P. (2001). Mil y una dimensiones del aprendizaje de la estadística. Estadística Española, 43, 148, 189-207.
Belli, G. (2000). The teaching of statistical consulting skills. Paper presented at the Meetings of the American Educational Research Association, New Orleans, April 24-28.
Ben-Zvi, D. (2001). Technological Tools in Statistical Education, In Jornades europees d'estadística. L'ensenyament i la difusió de l'estadística. Ed. Conselleria d'Economia, Comerç i Indústria, Palma de Mallorca. 207-220.
Bottino, R.M. (2001). Advanced Learning Environments, In Computers and Education: Towards an Interconnected Society, M. Ortega and J. Bravo Ed., Kluwer Academic Publishers, 11-27.
Chanter, D.O. (2001). Some Anecdotes and Analogies for Illustrating Statistical Ideas, in The best of Teaching Statistics, http://science.ntu.ac.uk/rsscse/ts/bts/chanter/text.html
European Commission (2002). eEurope Benchmarking Report, Brussels. http://europa.eu.int/information_society/eeurope/benchmarking/index_en.htm
European Commission (2004). http://elearningeuropa.info
Gärdin, O. (2002): The New Economy New challenges for the statistical system, In The International Association for Official Statisticians (IAOS) Conference, London.
López, A.J. & Pérez, R. (2001a). An experience on virtual teaching: AulaNet, in Computers and Education: Towards an Interconnected Society, M. Ortega and J. Bravo Ed., Kluwer Academic Publishers, 207-214.
López, A.J. & Pérez, R. (2001b). La enseñanza de Estadística con nuevas tecnologías. Algunas experiencias universitarias, in Jornades europees d'estadística. L'ensenyament i la difusió de l'estadística. Ed. Conselleria d'Economia, Comerç i Indústria, Palma de Mallorca, 221-232.
Mills, J.D. (2002). Using Computer Simulation Methods to Teach Statistics: A Review of the Literature, Journal of Statistics Education, 10 (1), http://www.amstat.org/publications/jse/v10n1/mills.html
Moore, D. (1997). New pedagogy and new content: the case of statistics. International Statistical Review 65, 123-165.
Mulekar, M. (2000). Internet resources for AP Statistics Teachers, Journal of Statistics Education, 8 (2), http://www.amstat.org/publications/jse/secure/v8n2/mulekar.cfm
Pérez, R. & López, A.J. (2003). Economic Data Analysis with ADE+. Summarizing presential and virtual experiences, Proceedings of the IASE Satellite Conference on Statistics Education and the Internet,
http://www.ph-ludwigsburg.de/iase/proceedings/index.html
Pérez, R., López, A.J. & Río M.J. (2002). Learning statistics online. Facts and figures from a three-year experience, International Conference on Information and Communication Technologies in Education, vol. 3, 1441-1444, Badajoz.
Pérez, R. et al (1997). Análisis de datos económicos I. Métodos descriptivos. Ed. Pirámide, Madrid.
PLS Ramboll (2004). Studies in the context of the E-Learning initiative: Virtual Models of European Universities, EU Commission, DG Education and Culture.
Reading, C. (1998). Reactions to Data: Students’ Understanding of Data Interpretation. In L. Pereira-Mendoza, L.S. Kea, T.W. Kee & W.-F. Wong (Eds), Statistical Education – Expanding the Network. Proceedings of the Fifth International Conference on Teaching of Statistics. (1427-1433). Singapore.
Reding, V. (2001). The role of the European Community in creating the knowledge and information society, Zentrum für Europäischen Integrationsforschung, University of Bonn, http://www.europa.eu.int/comm/elearning
Relander, T. & Kunnas, R. (1999). The Impact of the Internet on the Production and Dissemination of Statistics, in Meeting on the Management of Statistical Information Technology, Statistical Commission and Economic Commission for Europe.
Salinas et al. (2002). Red de servicios y estructuras comunes en el Campus Virtual Compartido del G9 de Universidades, Informe final del proyecto EA2002-0109, Programa de Estudios y Análisis, Secretaría de Estado de Educación y Universidades.
Tiffin, J.and Rajasingham, L. (1995), In Search of the Virtual Class: Education in an Information Society, London and New York.
Yilmaz, M. (1996). The Challenge of Teaching Statistics to Non-Specialists, Journal of Statistics Education, 4 (1), http://www.amstat.org/publications/jse/v4n1/yilmaz.html
About the Authors
López, Ana Jesús Tel: 34 985103759 | Ana Jesús López is Professor of Statistics and Econometrics at the University of Oviedo, Spain. She received her Ph.D. in Economics at the University of Oviedo (1991) and Bachelor in Economic Sciences at the same University (1986). Her research activities are related to three fields: measurement of economic inequality, regional modelling and forecasting, and the socio-economic impact of the Information and Communication Technologies (ICTs), mainly the e-learning. Dr. Lopez has been involved in several research projects and she is author of several publications in international and Spanish journals. |
Pérez, Rigoberto Tel: 34 985103748
| Rigoberto Pérez is Professor of Statistics and Econometrics at the University of Oviedo, Spain. He is Ph.D. in Economics at the University of Oviedo (1985) and Bachelor in Mathematics at the University of Santiago de Compostela (1978). Professor Pérez published several books and articles in international and Spanish journals, has been involved in several research projects, and has supervised seven Doctoral Dissertations and eight Post-Graduate Dissertations. In his current position of Director of the Innovation Center of the University of Oviedo and the Shared Virtual Campus of the G9 Group (including nine Spanish Universities) he is also involved in several projects dealing with the ICTs impact, the e-learning and the development of suitable quality indicators. |