| October_08 Index | Home Page |
Editor’s Note: This study validates the ever present need to learn through a number of communication channels and the desirability of designing materials to accommodate different student learning style preferences.
Effectiveness for Learning Styles in Theory and Practice of “PC Hardware Maintenance”
Dr.Vasant G. Wagh
India
Abstract
Self-instructional learning materials are needed for laboratory based topics and subjects. Print and video of lectures are two options now available to a self-learner. The Computer Assisted Learning (CAL) packages currently available in India are primarily demonstrations with a passive approach to learning. Psychology of Learning (Learning Theory) is lacking in design of these CAL packages. The learner is assumed to be equipped with prerequisites and a self evaluation component is generally lacking.
In this study, an Interactive Computer Assisted Learning (ICAL) package is developed based on a Learning Strategy. A prime objective is to involve active learning rather than passive viewing and listening. Different learning mechanisms and approaches are taken into consideration. The present work is multimedia improvisation of Audio-Vision concept (Gaikwad et. al. 1994, 1995) developed and implemented at the YCM Open University, Nashik. Classroom and laboratory simulations are two major components of the ICAL package.
The ICAL package as developed was tried, component by component, on postgraduate degree students of Electronic Science. This paper describes the design and implementation and discusses the results.
Keywords: Learning Theory, Computer Assisted Learning, Audio-Vision, Active Learning, Self Instructional Learning Material, Class Room Simulation, Laboratory Simulation, Cognitive Theory of Multimedia Learning.
Design of CAL: Psychological View
Understanding of a concept, laboratory related techniques, what, why and how-to topics are followed by application in similar and diverse situations. Learning occurs through mental and psychomotor skill development. Often, print material is static and fails to promote understanding of a concept, laboratory related technique, what, why and how-to-do topics. If understanding is not clear, concept application becomes difficult and in some cases impossible. Availability of multimedia and graphical animation has made it possible to look at this problem afresh [18,24].
Development of Computer Aided Learning (CAL) package is looked up on as a mere technique rather than Science. In order to be useful to a learner, a CAL package should be self instructional. It should involve an individual actively in participative learning rather than passive listening and viewing. Hence Computer Aided Learning (CAL) package should be Interactive Computer Aided Learning (ICAL). Currently available CAL packages are demo type, containing a video or text with voice. They lack self-evaluation as well, a necessary component to improve self confidence and, in effect, may influence and/or change affective behaviors to some extent.
Addressing problems in “PC Hardware Maintenance & Troubleshooting” needs mental and psychomotor skills. Problem solving performance is basically a process oriented activity which is aided by conceptual knowledge [12]. A cognitive tool that helps problem-solvers should include the required procedural knowledge as well as conceptual knowledge. Problem solving performance is closely related to contextuality of the problem [17]. Contextuality denotes the meaningfulness of the situation as interpreted by a learner’s prior knowledge and experience. For this reason, several problem-solving researchers have focused much of their attention on enhancing the contextuality during problem solving such as design of real problems that he or she solves every day and the transfer of problem solving skills to a new context [21].
Knowledge maps connect concepts called ‘nodes’, with other concepts by labeled or sometimes unlabelled arrows, called ‘links’ and have been regarded as more effective representations than others in problem-solving [10]. The knowledge map is especially useful in problem-solving because it enables learners to externalize their internal problem-solving process: to obtain helpful information embedded in a problem, to retrieve and reorganize their prior-knowledge with the new knowledge related to the problem selectively, to identify possible constraints and to generate insightful ideas [9,19,22].
Problem-solving performance can be improved by selectively choosing a combination of conceptual and procedural representations [1,13]. From a cognitive load perspective, Sweller found that learners who were presented with instructional materials that integrated text and graphics solved geometry problems better and with less effort than learners who were presented with instructional materials that provided text separately from graphics illustrations [23]. This principle has been repeatedly demonstrated [2,11] as long as the text and graphics are complimentary, rather than redundant. Jonnassen et. al. [10] argued that procedural knowledge should be based on conceptual knowledge because no action can be performed without the awareness of necessary conceptual information to perform a given procedure.
Learning is an extremely complex process. A learning style is a students’ consistent way of responding to and using stimuli in the context of learning. Three learning styles or intelligences that help us to discover different forms of mental representation are:
- VKA (Visual, Auditory Kinesthetic)
- Kolb’s learning inventory
- Howard Gardner’s Multiple Intelligence
We use learning styles to develop an adaptable learning environment that presents material in variety of methods than trying to determine each learner’s personal style. The more styles you address, the easier the instruction will be received by the learners. Learning styles [3] come from three schools of thought:
- Perceptual Modality
- Information Processing and
- Personality Patterns
A learner learns through experiences. Aldrich [3] argues that there are six criteria that compose an educational experience:
Delivery Elements
Simulation
Games
Pedagogy
Pedagogical or didactic elements ensure that learner’s time is productive. Game interactions provide familiar & entertaining interactions. Simulation elements provide virtual reality.
Content Types
Systems
Cyclical
Linear
Content types describe directional flow of the content. Linear content is presented with one event or step following the next. Cyclical content addresses “muscle memory”. System content deals with complex relationships.
Whether multimedia instruction is good or bad depends almost entirely on those who design the multimedia materials and those who teach with them [22,12]. Does a set of rules or an algorithm which can be used in the design of self learning CAL package exist? Does Learning, a mental process, have any place in the design of CAL? Can it be designer-as a person, independent? Is it possible to write down step-by-step procedures? Present work is exploring more in this area.
Mayer’s research [14] indicates that students’ ability to “transfer” information that had been presented to them multimedia-style showed a whooping 89 percent improvement in performance over traditional book-based methods. Broken down into categories, when text and graphics were combined in a teaching presentation, students’ transfer ability went up 68 percent; when the information was presented orally rather than read by the student, the transfer rate went up 80 percent. Mayer [14] defines “transfer” of information as the ability of students to integrate the information into their already existing knowledge base and use it to generate ideas or solve abstract problems (i.e. the ability to understand and use the information).
Mayer [14] finds that, when certain types of material are presented using multimedia methods, retention (defined as the ability to recall facts or steps in a process) increases by an average of 23 percent; when text and graphics are combined, retention goes up an average of 42 percent; and if the text of a presentation is spoken rather than read-if students hear the words, rather than read them, retention goes up an average of 30 percent.
Can understanding, hence self learning be improved if the stress of study is controlled? Lipnicki [5] finds that, noradrenalin, a hormone produced in the brain by stress, reduces one’s ability to detail and reason. Can ICAL designed with a learner-centered approach help to reduce stress of study? Can any-time any-where use of a properly designed ICAL package facilitate and improve self-learning?
Medium (technology), message (content) and the messenger (presenter or teacher) are inextricably linked [14,20]. Overuse of multimedia (technology) has a detrimental effect [14] on a student’s ability to learn. Technology traps always exist and should be avoided. Mayer’s research [20] suggests that, when used correctly, multimedia both improves information retention and understanding. The solution to avoiding a technology trap is to adopt a Learner-centered approach that is consistent with the way the human mind works. Media selection [24,8,14] plays a vital role in the development of self-instructional material. However, if we accept Mayer [14] and Simons [20] that quality of a content, skill of a presenter will decide if the media can help facilitate understanding or work against it. This suggests we should consider “Learning-Processes, Styles and Environments” in the presentation of “content (message)”.
This present work tries, through theICAL package, to implement Mayer’s [14] “Cognitive Theory of Multimedia Learning” and incorporate relevant steps of “Learning Processes”.
Design considerations
The ICAL package is organized into the following modules:
Theoretical Details - Internal and external parts with the help of class room simulation
Practice session
Before you buy
Assembling a PC
Installation of an OS such as DOS, Windows
Installation of a new software
Installation of a new hardware
Maintenance of hardware parts
Maintenance of software components
Troubleshooting
Different hardware parts
Different software modules
Each module has been designed with specific learning objective.
Since the more learning styles you address, the easier the instruction will be received by the learners [3], different modules use different presentation “Styles and Environments”.
Hardware maintenance and troubleshooting is a cognitive and psychomotor task. Since problem-solving performance can be improved by selectively choosing a combination of conceptual and procedural representations [1,10,13], most of the modules use this learning framework.
Theoretical background is presented with audio-vision technique [6-8,2,11] in a didactic or pedagogic presentation style [3]. In some places, a dynamic graphic is used to explain the concepts [23].
Practice session, that occurs before actual PC assembling module, uses Cyclical Content presentation mode. Cyclical Content Addresses “muscle memory” and helps in actually learning a skill [1, 3].
Test yourself component in each module is included at the end of the modules to help the learners in finding their status and improving their self confidence and affective behaviors [21].
Project Details
In the present study, following topics from “PC Hardware Maintenance and Troubleshooting” are included in an Interactive Computer Assisted Learning (ICAL) Package: Development of ICAL package is organized in two CDs entitled PCHMTS-1 and PCHMTS-2. PCHMTS-1 Consists of following five Modules: Module-1: External parts 1.1) Monitor, 1.2) Keyboard, 1.3) Mouse, 1.4) Cabinet, 1.5) Speaker, 1.6) Floppy drive, Module-2: Internal parts 2.1) Motherboard, 2.2) BUS, 2.3) Expansion card, 2.4) Memory 2.5) I/O Devices, 2.6) POST, 2.7) Test yourself. Module-3: DOS 3.1) Basic DOS commands, 3.2) Practice of DOS Commands, 3.3) Test yourself. Module-4: Windows 4.1) Desktop, 4.2) Start menu, 4.3) Task bar, 4.4) Accessories, 4.5) Explorer, 4.6) Control panel, 4.7) Test yourself. Module-5: Evaluate Yourself PCHMTS-2 Consists of following six modules: Module-1: Assemble a PC Module-2: BIOS 2.1) BIOS, 2.2) Test yourself. Module-3: Installation 3.1) Fdisk/formatting, 3.2) Installation of Operating System, (O.S.) 3.3) Installation of keyboard, 3.4) Installation of printer, 3.5) Installation of MODEM, 3.6) Installation of CD-ROM, Module-4: Troubleshooting 4.1) Storage devices, 4.2) Safe mode, 4.3) Display problems, 4.4) Sound problems, Module-5: Virus 5.1) Introduction to virus, 5.2) How to handle a virus attack, 5.3) Test yourself. Module-6: Evaluate Yourself PCHMTS-1 is organized into five modules. PCHMTS-2 is organized into six modules. All subtopics are linked to a main module. Class room simulation is done with the help of series of interactive animated slides with relevant audios attached. The student is also provided with an option of repeating a whole slide, audio only, or continue. Online self-evaluation is an essential part of each module. Topic/concept is explained first with the help of audio-vision [6,7] (class room simulation) supported by dynamic graphical animation. It is followed by a formative self evaluation test. The second step is “Learn by Doing”. In this part, application of acquired knowledge is checked in a practice session. A step by step solution (a guided walk through) is provided for various common problems. Human memory and learning are co-related mental activities. Short memory is converted in to a long memory by repetitions, practice and application of the knowledge to diverse problems [16]. Graphics are created in Adobe Image Ready and Adobe Photoshop; animations are created in Macromedia Flash. Each audio (MP3) file is separate with enabled recompression. Gold Wave and Adobe-Auditions are used to create audios. Separate video with audio on assembling a PC is included. Practice sessions (sprite) are developed by Image Ready. All Graphics, Audio, Video, Sprite, and Text are linked by using RLE (Reality Learning Engine). RLE is a Learning Management System used to make interactive multimedia lessons.
1.7) CD-ROM, 1.8) Test yourself.
1.5)Test yourself.
3.7) Installation of sound card, 3.8) Test yourself.
4.5) Booting Problems, 4.6) System Slowdown problems, 4.7) MODEM problems,
4.8) Printer problems, 4.9) General Instructions, 4.10) Test yourself.
Hypotheses
The following null hypotheses were set for the present study:
H0: There is no significant difference between learners of PC Hardware, its Maintenance and Trouble shooting using conventional face to face method and method based on ICAL.
H1: ICAL package of PC Hardware, its Maintenance and Trouble shooting improves level of understanding of learners better than conventional face to face method.
Population and Sample for the Study
Students of M. Sc. (Electronic Science) were chosen as a population for this study. Students admitted to M. Sc. may come from B.Sc. (Electronic Science), B.Sc. (Physics) of PUNE University and B.Sc. (General) from other universities. Sampling for the present was done at two stages phase-1 and phase-2. This sample was chosen because some of them have studied the subject in class room with face to face environment and others are totally illiterate in this area. A face to face certificate course of 2 months (48 Hours) was organized before the students were shown the ICAL tool under test.
First phase sample consisted of 21 students of M.Sc. Part-I and 13 of M.Sc. Part-II. of academic year 2004-05. These students were subjected to Pre-tests and Post-tests with the help of self-test modules.
Second phase sample consisted of 22 students of M.Sc.I
Methodology
The present study aims at testing effectiveness of ICAL packages in relation to two independent variable learning styles and level of interactivity. Sampling for the present study was done at two stages. Students of M.Sc.I and M.Sc.II (Electronic Science) of (academic year 2004-05) were chosen as a population in the first phase and students of M.Sc. I for (academic year 2005-06) were chosen as a population in the second phase for this study. The students in the first phase sample were chosen because they had studied the subject in classroom with face-to-face environment. These students were subjected to Pre-tests and Post-tests with the help of self-test modules. In the second phase, students of M.Sc. I were divided into experimental and control groups. The control group was subjected to face-to-face teaching and the experimental group used ICAL learning packages. The retention test was administered again on both groups after three weeks.
Data Collection
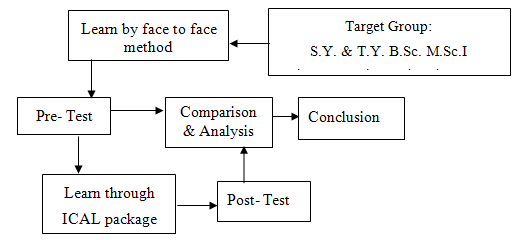
In the first phase, a Pre-test was conducted and marks obtained by the students were noted. These students were then asked to study the ICAL package module-wise. Students studied the modules at their own pace. They were given a freedom to repeat a module till their satisfaction. After finishing every module, the post-test was administered. The same procedure was adopted for the complete package. Scores of post and pre-tests were noted module-wise. Figure 1 shows the implementation strategy used.
In second phase, the sample was divided into a control group and an experimental group by the lottery method. The cognitive level of both groups was same because they were from same class and same level. The control group was subjected to face-to-face teaching and the experimental group used the ICAL package for learning. After compilation of the face-to-face and ICAL Post-test, marks obtained were noted for each student. The retention test was administered on both the groups again after three weeks. Figure 2 shows implementation strategy used.
Implementation Strategy
For first Phase
Fig. 1
For second phase
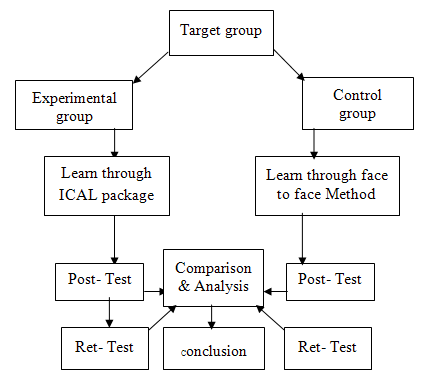
Fig. 2
Observations
In first Phase students of Electronic Science M.Sc.–I and M.Sc.–II form two samples. Scores of individual modules, each CD and aggregate scores of both the CDs were recorded. Figure-2 and Figure-3 show performances of pre and post-tests.
Statistical computations for Paired-T values and Confidence Intervals (CI) are done for both the samples and CDs individually. Tables show the results of the calculations.
Results And Discussions
Table 1: M. Sc. I (for CD1/ PCHMTS-1) Paired T for C1=Pre-test and C2=Post-test N= Number of students (Sample)
Table 1
M. Sc.-I (for CD1/ PCHMTS-1)
Description | Number (N) | Mean | Std Dev | |
| (Pre-test) C1 | 21 | 53.048 | 3.057 |
| (Post-test) C2 | 21 | 59.571 | 1.248 |
| Difference | -- | -6.523 | 2.562* |
*This does not represent difference between standard deviations of C1 and C2.
It represents std. dev. of (C1-C2).
Range of mean difference for 5% confidence level (CL) (i.e. 95% of confidence interval (CI) is: [-7.690, -5.358].
Computed paired-T Value = -11.67, P-Value = 0.00
From above table, we observe that average score increases significantly. This shows that PCHMTS-1 helps in increasing average score of M. Sc.-I students. Its T-Value = 11.67 as against table T-values of 1.721 (for 5% level of significance) and 2.518
Table 2: M. Sc. II (for CD1/ PCHMTS-1)
Paired T for C1=pre-test and C2=post-test
Table 2
M. Sc.-II (for CD1/ PCHMTS-1)
Description | Number (N) | Mean | Std. Dev. |
(Pre-test) C1 | 13 | 46.15 | 5.44 |
(Post-test) C2 | 13 | 58.38 | 1.85 |
Difference | -- | -12.23 | 4.07* |
*This does not represent difference standard deviations of C1 and C2.
It represents std. dev. of (C1-C2).
Range of mean difference for 5% confidence level (CL) (i.e. 95% of confidence interval (CI) is: [-14.69, -9.77]. Computed paired T-Value = -10.85, P-Value = 0.00 From above table, we observe that average score increases significantly. This shows that PCHMTS-1 helps in increasing average score of M. Sc.-II students.
Table 3
M .Sc.-I (for CD2/ PCHMTS-2)
Description | Number (N) | Mean | Std. Dev. |
(Pre-Test) C1 | 21 | 51.048 | 3.795 |
(Post-Test) C2 | 21 | 67.286 | 1.875 |
Difference | Not Applicable | -16.238 | 4.113* |
Range of mean difference for 5% confidence level (CI) (i.e. 95% of confidence interval (CI) is: [-18.158, -14.414].
Computed Paired T-Value = -18.15, P-Value = 0.00
From above table, we observe that average score increases significantly. This shows that PCHMTS-2 helps in increasing average score of M. Sc. I students. Its T-Value = 18.15 as against table T-values of 1.721 (for 5% level of significance) and 2.518 (for 1% level of significance) show that it is highly significant.
Table 4
M. Sc.-II (for CD2 /PCHMTS-2)
Description | Number (N) | Mean | Std. Dev. |
(Pre-Test) C1 | 13 | 56.38 | 6.73 |
(Post-Test) C2 | 13 | 66.38 | 3.99 |
Difference | Not Applicable | -10.00 | 5.99* |
*This does not represent difference standard deviations of C1 and C2. It represents std. dev. of (C1-C2).
Range of mean difference for 5% confidence level (CL) (i.e. 95% of confidence interval (CI) is: [-13.62, -6.38]. Computed paired T-Value = -6.02, P-Value = 0.00
From above table, we observe that average score increases significantly. This shows that PCHMTS-2 helps in increasing average score of M. Sc.-II students. Its T-Value = 6.02 as against table T-values of 1.771 (for 5% level of significance) and 2.650 (for 1% level of significance) show that it is highly significant. Table 5 shows paired-T values for both CDs & samples and Table 6 for a package at 1% level of significance (LOS).
Table 5
Paired-T values for both CDs
PCHMTS-1 | PCHMTS-2 |
| ||
Class | # Students | T-Values | ||
M.Sc.-I | 21 | 10.85 | 6.02 | |
M.Sc.-II | 13 | 11.67 | 18.15 | |
Table 6
1% Level of Significance
Class | # Students | T-value | T-value from Table |
M.Sc- I | 21 | 8.435 | 2.518** |
M.Sc II | 13 | 14.91 | 2.650** |
** Highly significant α = 0.05, * L.O.S = level of significance
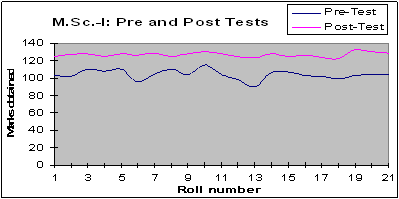
Fig. 3: Performance of Pre and Post Tests (M. Sc.-I)
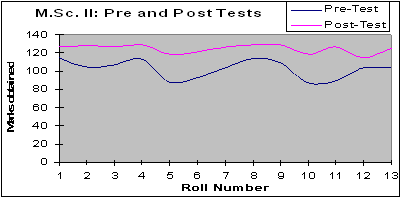
Fig. 4: Performance of Pre and Post Tests (M. Sc.-II)

Fig. 3: Performance of Pre and Post Tests (M. Sc.-I)

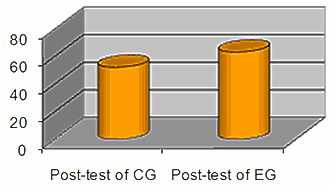
In the second phase, students of Electronic Science M.Sc.–I are divided into control and experimental groups. Scores of Post test of ICAL and face-to-face were recorded.
Comparison of means of post test for M.Sc.I
Table 6.7
Mean scores of post tests
Test | Number | Mean | S.D. | Paired t-value |
Experimental group | 11 | 63 | 1.79 | 12.90 |
Control group | 11 | 52 | 3.35 |
Fig. 5 (Graph-6.12): Comparison of average mean scores M.Sc. I.
Observations
From above table and graph, we observe that average mean score of post test of experimental group is at higher level than control group.
Statistical analysis for calculating t indicated that t = 12.90 for 10 degrees of freedom (for a sample size N=11). This value of t is higher than the standard or table values of 1.796 (for 5% level of significance) and 2.718 (for 1% level of significance). It shows a significant difference for learner performance in both stages. It also indicates that the achievement of learners in the experimental group are significantly higher than achievement of control group learner in M.Sc. I. Hence hypothesis H0 is strongly rejected and H1 accepted.
Comparison of means of Retention test for M.Sc.I
Retention tests were administered separately for control group and experimental groups.
Table 6.8
Mean scores of retention test.
Test | Number | Mean | S.D. | Paired t-Value |
Experimental group | 11 | 61 | 1.44 |
|
Control group | 11 | 45 | 2.68 |
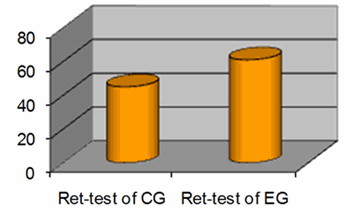
Fig. 6 (Graph-6.13): Comparison of average mean scores M.Sc. I
Observations
From above table, and graph we observe that there is significant difference in the retention of knowledge in PCHMTS for experimental and control group of M.Sc.I Statistical analysis for calculating t indicated that t = 20 for 10 degrees of freedom (for a sample size N=11). This value of t is higher than the standard or table values of 1.796 (for 5% level of significance) and 2.718 (for 1% level of significance). It also indicates that the mean score for retention of the experimental group is at higher level than retention and post test scores of the control group. Thus, the results indicate that the ICAL package does help the students to acquire and understand knowledge, acquire skills, and retain what they have learned.
Conclusions
The selected groups scored significantly higher in the post-test than in the pre-test. It shows that ICAL package in PCHMTS is effective in enhancing acquisition of knowledge and understanding and in skill development. The achievement of the PCHMTS experimental group is significantly higher than achievement of the control group. It shows that ICAL package used as a teaching resource for the experimental group wass more successful than the conventional system. There are differences in knowledge gain and knowledge retention on PCHMTS in both the experimental and the control group. This loss of knowledge is due to the time gap between the post test and retention test stage of the study and also due to absence of reinforcement between these phases. It should be noted that the retention score of knowledge for the experimental group is higher than post-test and retention-test scores for the control group. Thus, the result indicates that the ICAL package does help students and it enhances their acquisition of knowledge, understanding, skill development, and retention.
About the Author
Vasant G. Wagh Ph.D. is Reader in Electronics Department K.T.H.M. College, Nashik -2, Maharashtra State, India. Dr. Vasant completed his Ph.D. in YCM Open University in subject communication and his M.Sc. in electronic science at Poona University. He has 19 years of teaching experience in senior college. Presently he is working on a Minor Research Scheme supported by the University Grants Commission, New Delhi. Dr.Vasant G. Wagh,
Department of Electronic Science
K.T.H.M. College, Nashik 422 002
Maharashtra State, India
End Notes
Anderson J. The architecture of cognition, Cambridge, MA, Harvard University Press (1983)
[1] Chandler P. & Sweller J. The split attention factor in the design of instruction, British , Journal of Educational Psychology, 62(2), 233-246 (1992)
[2] Clark Aldrich Simulations and the Future of Learning: An Innovative Approach to Learning
[3] Conner, Marcia & Hodgins, Wayne (September 14, 2000) Learning Styles http://www.learnactivity.com/ learningstyles.html
[4] Darren M Lipnicki, Don G Byrne, “Thinking on your back: Solving anagrams faster when supine than when standing”, Cognitive Brain Research, Elsevier, 24(3), 719-722, August 2005.
[5] Gaikwad Madhav G, Sahashrabudhe Chandrakant, “Audio-Vision: A novel medium for self-paced learning”, National seminar on Management and Planning of Engineering Institutions, Shegaon (Maharashtra), Feb 5-6, 1994
[6] Gaikwad Madhav G, Vadnere Rajendra, “Audio-Vision: A novel medium for self-paced learning”, Media & Technology for Human Resources Development (MTHRD), Wiley Eastern Ltd., New Delhi, Vol. 6, Apr 1994, P3
[7] Gaikwad Madhav G, Vadnere Rajendra, “Selection of Media for Science & Technology Programmes at a Distance”, Indian Journal of Open Learning, New Delhi, Vol. 2, 1995, P73
[8] Hayes J. R. The complete problem solver (2nd edn), (Hillsdale, NJ, Lawrence Erlbaum Associates (1989).
[9] Jonnasen D. H. Beissner K. & Yacci M. Structural Knowledge: techniques for representing, conveying and acquiring structural knowledge (Hillsdale, NJ, Lawrence Erlbaum Associates (1993)
[10] Kalyuga S. Chandler P. & Sweller J. Managing spilt attention and redundancy in multimedia instruction, Applied Cognitive Psychology 13(4), 351-371 (1999).
[11] Lesgold A, Lajoie S “Complex problem solving in electronics”. In R. J. Sternberg & P. A. French (edn), “Complex problem solving :Principle and mechanisms. (Hilsdale, NJ:Erlbaum)
[12] Mayer R.E. & Wittrock M.C. Problem-solving transfer, in : D.C. Berliner & R.C. Calfee (Eds) Handbook of Educational Psychology (New York, Simon & Schuster Macmillan) 47-62 (1996)
[13] Mayer Richard E., “Multimedia Learning”, Cambridge University Press, 2001
[14] Moore M G “Surviving as a distance teacher”, The American Journal of Distance Education, 15(2), 1-6, 2001
[15] Moore M G “Three type of interactions”, The American Journal of Distance Education 3(2), 1-6, 1989
[16] Norman H.G. & Schmidt G. R. (2000) Effectiveness of problem-based learning curricula: theory, practice and paper darts, Medical Education, 34(9), 721-728.
[17] Schuemer R, “Some psychological aspects of Distance Education”, Institute for Research into Distance Education, Hagen, Germany, 1993 (ED 357 266)
[18] Sherman R.A. & Gruneberg K. Concept mapping with multimedia on the web, Journal of Educational Multimedia and Hypermedia 9(4), 313-331 (2000)
[19] Simons Tad, “The multimedia paradox”, Presentations Magazine, http://www.presentations .com/presentations/trends
[20] Sinnot J.D. Everyday problem-solving: theory and applications (New York, Praeger Publications.) 1989
[21] Stoyanov S. Cognitive mapping as learning method in hypermedia design, Journal of Interactive Learning Research, 8 (3/4), 309-323 (1997)
[22] Sweller J. Cognitive Technology: some procedures for facilitating learning, problem solving in mathematics and science, Journal of Educational Psychology, 81, 457-466, (1989)
[23] Wills Barry, Guide #3 “Instructional Development for DE”, #6 “Computers in Distance Education”, #8 “Strategies for Learning at a Distance”, Distance Education-Strategies, Tools and Distance Education-A Practical Guide, Englewood Cliffs, NJ: Educational Technology Publications, (1993)
