| August 2009 Index | Home Page |
Editor’s Note: The authors combine enthusiasm for the new course with a scientific approach to design and development. They recognize the newness of astrophysics to college level curricula in India, and in the absence of a suitable text book, embed much of the content in a multimedia package designed for distance learning. Best of all, the materials were pilot tested as they were developed, and the course can be web enabled and made available on a global basis. This is an inspiring and evocative article.
Design, Development and Effectiveness of a Digital
Interactive Multimedia Package in Astrophysics
for Undergraduate Students
G. P. Pimpale and R. V. Vadnere
India
Abstract
Though astronomy is the oldest and a very interesting branch of science, it is observed that talented students do not seek careers in this domain. Generally, they are interested in this subject as amateurs but do not pursue higher studies. Therefore, an interactive multimedia computer package has been designed and developed by the authors for undergraduate students in India to motivate them to pursue higher studies in Astrophysics. While designing the package, norms of distance learning were carefully followed. The textual part is given in easily palatable language and is well supported by a large number of diagrams, video clips, graphs, interactive numerical problems and self-evaluation tests. Two unbiased sample groups were formed by a simple random method from the population of undergraduate students in India. The experimental group was administered the whole package while the control group was exposed only to the textual material in the package. Both the groups were pre- and post-tested. A retention test was also given to the experimental group to know the effect of package with passage of time. Well known statistical tests were employed to interpret the data generated and assess the effectiveness of the package.
Keywords: Astronomy, astrophysics, multimedia, distance learning, interactive package, digital package, e-learning.
1. Introduction
A star studded night sky is loved by one and all, and the night sky is really an observatory available to everybody and anybody – free of charge! Astronomy refers to the study of positions and motions of objects beyond the earth’s atmosphere while Astrophysics is a branch of physics which deals with the physical theory of these objects. However, many times the term Astronomy is used in broad sense so as to include Astrophysics also. Astrophysics can be looked upon as the ‘Superset’ of all the branches of science as it encompasses the entire Universe. Study of Astrophysics begins from the sky, hence one can aptly say --" Sky is the lower limit" for this study. Because of the vastness and challenging nature of this subject, the authors have selected this area for investigation.
One of the authors (Pimpale) has been a lecturer in physics since last 28 years. What he has gathered from this prolonged experience as a teacher is that Astronomy is liked by many students; however their interest in this subject remains only at amateur level and therefore they do not pursue higher studies in this area. Therefore, as an attempt to motivate students for higher studies in this mind-blowing branch of knowledge, authors contemplated development of an interactive digital multimedia package using the norms of distance learning. Since the package has been made with distance learners in mind and since it could be made available on medium like CD or DVD, learners can use the material at their own pace and place.
Many concepts and phenomena in Astrophysics require visualization in three dimensional space. There are a large number of three dimensional diagrams which can be perceived on a computer alone. Also, the number of heavenly bodies is incredibly large; hence huge amounts of data need to be handled in this domain. Owing to these factors, the computer becomes an asset for this subject and is a widely used tool in distance learning because of its interactive nature. The authors have, therefore, developed an interactive computer multimedia (MM) package for Astrophysics.
2. Objectives
- Complete review of the MM material available in the market.
- Review distance learning courses in Astrophysics run by various universities across the globe.
- Develop the MM product taking into account the background and instructional needs of the target students.
- Acquaint students with basic ideas from Astrophysics with the help of the developed package.
- To assess effectiveness of the package.
3. Methodology
3.1 Background Study
There are many video cassettes and multimedia CDs 1 to 23 available in the market. There was a careful, in-depth review of the material. The study was carried out in context of both the text as well as the audio-visual contents. The authors discovered that many CDs are prepared by stalwarts in Astronomy and are, therefore, excellent to convey elementary information on Astronomy. However, they do not cater to the students who wish to take up a formal course of higher study in Astrophysics. Also, many CDs do not give graded knowledge – the method which is absolutely essential in distance learning.
Review included a large number of on-line courses conducted by various universities 24 to 33 across the globe. Many universities have designed the courses carefully and they are consistent with the methodology of distance learning. However, a major problem with these courses is that they charge heavy fees (in dollars) which students from a developing country like India cannot afford to pay. In western countries, Astronomy courses are part of curriculum. But in India we do not have such courses at the primary or secondary levels. Further, the number of courses in Astronomy and Astrophysics at the tertiary level is very small. In a very large country like India, it may not be possible for an undergraduate student to join such a course at a distant institution. Hence a dire need was felt to make a tailor made package for undergraduate students in developing countries like India. The package, when made available on a CD or when uploaded on the web, can make almost free-of-charge distance learning material in Astrophysics. According to the statistics given by the World Bank, 144 countries (out of 210) are classified as ‘developing.’ (http://web.worldbank.org/WBSITE/EXTERNAL/DATASTATISTICS/0,,contentMDK
20420458~menuPK:64133156~pagePK:64133150~piPK:64133175~theSitePK:239419,00.html), The authors hope that the present work could benefit students from these countries with a broad spectrum of normally available courses.
3.2 Developing the Multimedia Package
3.2.1 Design of the Textual Component
Firstly, a detailed syllabus for the package was framed. It included basic concepts from physics often required in the present area of study. Concepts included Newton’s laws, Kepler’s laws, Laws of conservation of angular and linear momenta, Black-body radiation, Electromagnetic spectrum, Wien’s law, Mirrors, Lenses, Resolution, Seeing, Magnification, Types of spectra, Doppler effect and red shift, Basic forces in nature, Nuclear reactions and Cosmic rays etc. The following elementary ideas from Astronomy and Astrophysics also formed a part of the syllabus-- Greenwich Mean Time (GMT), Universal Time (UT), Local and Sidereal Times, Julian Date, Big bang theory, Steady state theory, Hubble’s law, Cosmic microwave background, Birth, evolution and future of the solar system, Classification of stars by spectral class and by the Hertzsprung-Russell diagram, Life cycle of stars, Classification of galaxies, The Milky way galaxy, Formation and evolution of galaxies, Galaxy Clusters, Search for life in the universe, Astrobiology, Methods of search for extraterrestrials, Drake equation, Missions undertaken, etc.
Since the syllabus is for undergraduate students in India, their background was kept in mind during this design. The relevant mathematical part was included in the syllabus but the conceptual part was given more emphasis. Experts from this area were consulted to validate the content. After it was approved by them, the entire course was divided into seven units. The units were further divided into sections. The pattern adopted was in agreement with that used in the self-instructional material developed by the Open Universities in India. According to this pattern, a Unit starts with Objectives followed by Introduction. Then various topics are covered in different sections. After a few sections, a self-evaluation test, ‘Check Your Progress’, was given. It was an interactive quiz indicating the score immediately. The last section ‘Let Us Sum Up’ summarized the discussion in that Unit. Many interactive problems were given to the target students wherein they can ‘play’ with the formula by substituting different values of variables.
The textual part was prepared by referring to standard reference books 34 to
3.2.2 Visual Component
In all units, a large number of diagrams, astrophysical images, pictures and video clips 41 to 45 were incorporated to enhance the learning experience. In each section at-least one relevant diagram or one relevant image was included. Thirteen video clips were used in the package.
3.2.3 Audio Component
Almost all video Clips were supported by audio component to enhance the visual effect.
3.2.4 Soft-wares Used
Extensive use of the following soft-ware packages was made:
Macromedia Flash MX, Dreamweaver 9, Adobe Photoshop 6.0, Microsoft FrontPage 2002 (Version 10.2623.2625), Internet Explorer 7 (Version 7.0.6000.16711), Microsoft Excel 2002 (Version Microsoft Word 2002, 10.2614.2625) and Quick Heal Anti Virus Plus 2008 (Version 9.50), MiniTab 14.
3.3 Testing of the Package
To begin with, the package was made on a pilot basis. The pilot level package was then administered to a group of (12+) level i.e. undergraduate students. A tool in the form of an opinionnaire was designed by the authors. Opinions were sought as regards to the content, language, images, video clips and general structure of the package. Their feedback was taken into account seriously and the package was modified in light of the feedback received. Size of the final package is 233 MB and it is made up of 135 screens, 13 video clips, four interactive problems and 10 Self-evaluation tests.
3.4 Development of Print Material
Because Astrophysics has not been included in the curriculum of many universities in India, instructional material in the form of text book is not available. Therefore the authors developed a booklet giving basic concepts in that subject. This booklet was prepared for the control group. It had the structure similar to the multimedia package – seven units containing sections and subsections. The pattern adopted is consistent with that for the self-learning material in distance education.
3.5 Formation of Samples
The population for the present study was undergraduate students studying science. An appeal was made to such students in the city of Nasik (Maharashtra state) for this study. The authors received responses from 62 students. Out of these students, two equivalent groups were formed by a random sampling technique. One of the groups was arbitrarily designated as the experimental group and the other as control one.
3.6 Development of Tool for Testing:
In order to get the knowledge profile for Astrophysics of the target students, a pretest was given to them. For this testing, a tool was designed in the form of a questionnaire. It consisted of 30 multiple choice questions based on elementary knowledge of Astrophysics. Each question was given four options as possible answers – only one of them was correct. The questionnaire was validated with respect to subject contents and communication theory. For this validation, guidance from experts from these fields was sought.
A similar procedure was followed for the questionnaires developed for post and retention tests. All the three questionnaires contained questions of nearly the same difficulty level.
3.7 Testing of Samples:
Pre-test:
Both the groups -- experimental and control -- were pre-tested to get idea about their previous knowledge in Astrophysics. They were asked to attempt 30 questions in 30 minutes by ticking the option which they thought to be correct.
Post-test:
The experimental group was then exposed to the multimedia package developed by the researchers. A network of sixteen state-of-the-art computers was arranged for this purpose. The group was given nearly four hours of exposure. At the same time, the control group was given the print material to study. Then, both the groups were administered a post-test. The pattern of testing was the same as used for the pre-test.
Retention test:
A good package should have retention effect on the minds of users. To check whether the package developed by authors retained such impact or not, a retention test was given to the experimental group after one month.
4. Results and Discussion
4.1 Testing the scores for Normality
Before any data are subjected to statistical testing, it must be checked to see whether it fits in the normal distribution. If it does, a parametric test like the ‘t--test’ in statistics could be applied for the data analysis. If it does not, a non-parametric test needs to be used. To check for normality, the authors have plotted ‘probability graphs’ for the data.
“A probability plot is an alternative to the histogram that can be used to determine the shape, centre and spread of the distribution. It has the advantage that it is unnecessary to divide the range of the variable into class intervals, and it often produces reasonable results for moderately small samples (which the histogram will not).” 46
To get the Probability Plot, the following steps were taken:
a. For such plot, a special “Paper” (scale) is used. Such “papers” are available for normal, exponential and several other distributions.
“Probability paper is structured in such a way that the values in the cumulative frequency distribution of a set of data from a normal distribution fall on a straight line. It can be used to assess sample data for normality.” 47
In other words, if the data generated are plotted on the normal probability paper and if the points lie exactly or nearly along a straight line then the data is said to obey normal distribution.
b. First, data points are arranged in ascending order. This is called as the ranking of data. The serial number is named as Rank and is denoted by j. The corresponding score is called Strength and is shown by Xj. Xj is plotted on the X axis.
c. Then the sample cumulative frequencies are calculated. The plotting positions of points, Pj corresponding to these frequencies are calculated as given below.
Pj = ( j – ½ ) / n where n = sample size.
Values of Pj are multiplied by 100 to get percentage and are plotted on the Y axis.
As an illustration of this procedure, let us consider the data generated in the pre-test of the control group. Table 1 given below is obtained by using steps a), b) and c) given above.
Table 1
Values of Variables for Probability Plot for Control Group- Pre-test
Rank j | Strength (score) Xj | Cumulative frequency in percent Pj |
1 | 5 | 0.016129 |
2 | 5 | 0.048387 |
3 | 7 | 0.080645 |
4 | 7 | 0.112903 |
5 | 9 | 0.145161 |
6 | 10 | 0.177419 |
7 | 10 | 0.209677 |
8 | 10 | 0.241935 |
9 | 10 | 0.274194 |
10 | 10 | 0.306452 |
11 | 11 | 0.338710 |
12 | 11 | 0.370968 |
13 | 11 | 0.403226 |
14 | 12 | 0.435484 |
15 | 12 | 0.467742 |
16 | 13 | 0.500000 |
17 | 13 | 0.532258 |
18 | 13 | 0.564516 |
19 | 13 | 0.596774 |
20 | 13 | 0.629032 |
21 | 13 | 0.661290 |
22 | 14 | 0.693548 |
23 | 15 | 0.725806 |
24 | 15 | 0.758065 |
25 | 16 | 0.790323 |
26 | 16 | 0.822581 |
27 | 17 | 0.854839 |
28 | 18 | 0.887097 |
29 | 19 | 0.919355 |
30 | 19 | 0.951613 |
31 | 19 | 0.983871 |
The graph in Fig. 1 given below is plotted with the values of variables given in Table 1.
. 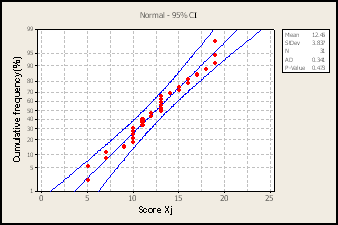
Figure 1: Probability Plot of Pre-test of Control Group
(The band implies 95% confidence interval).
From Figure 1 it can be observed that the data points lie nearly along a straight line. It implies that the data are normally distributed and we can proceed further for the parametric test. The P value of the Normality test is 0.473. It is greater than 0.05 which is the customary level of significance used in communication studies. This value of P obtained supports the statement that data are normal in nature.
Similarly the probability plots were obtained in Fig. 2, 3, 4 and 5. Figures 2, 3 and 4 indicate that the data points are normally or near-normally distributed with 95% confidence interval. Therefore the normality assumption is valid in these cases and employing parametric test could be justified. However Figure 5, which was plotted for the retention test of experimental group, showed that the data were not distributed normally. Hence, in that case, it was concluded that a non-parametric test was necessary.
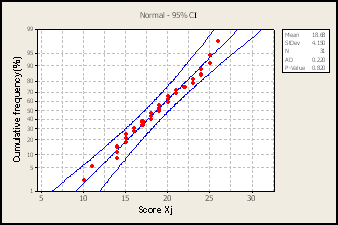
Figure 2: Probability Plot of Post-test of Control Group
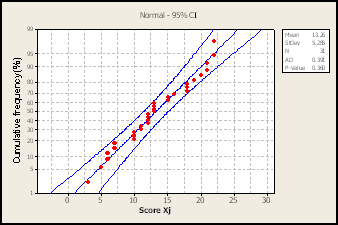
Figure 3: Probability Plot of Pre-test of Experimental Group
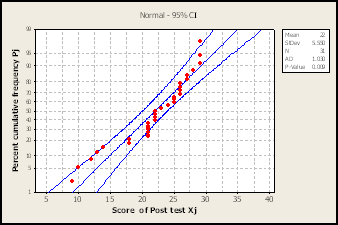
Figure 4: Probability Plot of Post-test of Experimental Group
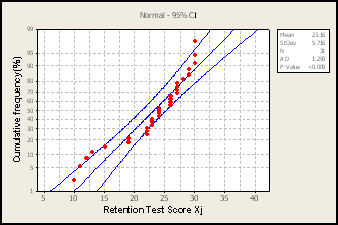
Figure 5: Probability Plot of Retention-test of Experimental Group
4.2 Comparison of Pre-tests of Experimental and Control Groups
Table 2
Two-sample t test for Pre- test (Experimental) and Pre-test (Control)
Sr. No. | Group | N | Mean | S. D. | t value 0.66 |
1 | Experimental | 31 | 13.26 | 5.28 | |
2 | Control | 31 | 12.45 | 3.84 |
The scores obtained in the Pre-tests clearly indicate that the Mean values and Standard Deviation values for both the groups are almost equal. The value of t is very much less than the table value 1.96. Hence from the tables given in the standard statistical books 48, 49 for area under the normal curve, we can conclude that there is no significant difference between the experimental and control groups formed by the researchers. Therefore it could be concluded that the previous knowledge of Astrophysics of both the groups is of the same level and hence they are unbiased.
4.3 Comparison of Pre and Post Tests of Experimental Group
Table 3
Paired t-test for Pre and Post tests of the Experimental Group:
Sr. No. | Test | N | Mean | S. D. | T value |
1 | Post | 31 | 23.16 | 5.72 | |
2 | Pre | 31 | 13.25 | 5.29 | 10.35 |
Table 3 shows that the Mean value for post-test is much greater than the corresponding value for pre-test. The t value > the table value 2.58. Hence it can be inferred that there is significant achievement (at 0.01 level of significance) in the knowledge of experimental group after it was exposed to the package.
4.4 Comparison of Pre and Post Tests of Control Group
Table 4
Paired t-test for Pre and Post Tests of the Control Group
Sr. No. | Test | N | Mean | S. D. | T value |
1 | Post | 31 | 18.68 | 4.15 | 7.45 |
2 | Pre | 31 | 12.45 | 3.84 |
Table 4 shows that the Mean for Post-test is greater that the corresponding value for Pre-test. The test statistic i.e. t value > the table value 2.58. Hence it can be inferred that there is significant achievement (0.01 level of significance) in the knowledge of the control group after it was administered the print material developed by the researchers.
4.5 Comparison of the Experimental and Control Groups
Table 5
Two Sample t-test for the Difference between Mean Values
of Experimental and Control Group
Sr. No. | Group | N | Mean | S. D. | T value | |
1 | Experimental | 31 | 9.90 | 5.33 | 2.90 | |
2 | Control | 31 | 6.23 | 4.65 |
Table 5 shows two sample t – test applied for the difference between the Mean values obtained for both the groups. The t value > 2.58. Hence it can be concluded from the probability area curve that the difference between the Mean values is not due to the sampling error but due to the treatment given to the Experimental group. There is significant achievement (0.01 level of significance) in the knowledge of the experimental group as compared to the control group.
4.6 Comparison of the Post and Retention tests of Experimental Group
From Figure 5 it is observed that the scores are non-normal. Hence a non-parametric test is required. In the present case, the scores are related to each other i. e. there are matched pairs in the data. Therefore the Wilcoxon matched-pairs test is applicable here. It is also called the Signed rank test. Results obtained are given in Table 6.
Table 6
Performance of Experimental Group in Post and Retention Tests
(Wilcoxon matched-pairs test)
N | n | T | UT | σT | z value | Table value |
31 | 28 | 10.5 | 203 | 43.91 | (- 4.38) | (- 2.58) |
where N = number of students in the experimental group
UT = Mean = n (n+1)/4,
σT = Standard deviation = [n (n+1) (2n+1)/24]1/2
z = Test statistic = (T - UT)/ σT
n = [(number of matched pairs) – (number of dropped pairs, if any)].
Table 6 shows that the test statistic z = (- 4.38). This value is smaller than the table value (-2.58). Hence from the area under probability curve we can conclude that the difference in means is not due to sampling error. It implies that there is significant retention (at 0.01 level of significance) of knowledge of Astrophysics for the experimental group even after one month.
5. Discussion of Results and Conclusions
In the present work, a digital interactive multimedia package and print material were developed for communicating elementary ideas from Astrophysics to undergraduate students in India. Therefore, the undergraduate students formed the target population. The sample consisted of 62 respondents. Out of the sample, two equal and equivalent groups were formed by simple random method. Thus each group consisted of 31 students. Arbitrarily, one of the groups was designated as the experimental group and the other as the control group. The t-test and the Wilcoxon matched-pair test were used for the analysis. They showed that the experimental group did very well compared to the control group. Also, there was statistically significant retention (at 0.01 level) of knowledge. All these results are indicated in Tables 1-5. Hence it can be inferred that the difference between achievements of the two target groups is not due to the sampling error but because of the treatment given to the experimental group.
The work can be extended by incorporating more 2D and 3D animations, more interactive problems and graphs, quizzes etc. The package can be made web-enabled so that all those across the globe who are interested in this work can be benefited. It is possible to make the package in vernacular languages or it may be made in bilingual mode (English + vernacular language) so that it is more convenient to use.
Acknowledgement
The author (Pimpale) would like to give special thanks to the Indira Gandhi National Open University, New Delhi, India for funding this research work. He is also indebted to Prof. Ajit Kembhavi [Director, Inter-University Centre for Astronomy and Astrophysics (IUCAA), Pune, India) for his constant encouragement and guidance. Thanks are also due to the library staff of IUCAA and due to Shri P. P. Joshi, Shri Y. B. Bhavsar and Shri M. B. Kulkarni from Nasik, India for their help.
References
- McDonough, Thomas R.: Search for extraterrestrial intelligence: Listening for life in the cosmos. New York. John Wiley and Sons, Inc., 1987.
- James Anthony and Michael McDonnell (ed.): Cosmic dust. John-Wiley and Sons, 1978.
- National Aeronautics and Space Administration: Guide to astronomy village: Investigating the universe version 1.0: A multimedia program for space science 1996.
- Parallax Multimedia Inc.: Galaxy guide: A journey through the constellations. Parallax Multimedia Inc., 1996.
- Astronomical Society of the Pacific: Realsky. (Available on 9 CD-Roms). Astronomical Society of the Pacific, USA, 1997.
- Vigyan Prasar: Celestial shadow play. Vigyan Prasar, New Delhi, India. 1999.
- CD Titles: Solar System and Beyond. CD Titles Inc., USA. 1996.
- Astronomical Society of the Pacific: Exploring our solar system. Astronomical Society of the Pacific, 1997.
- Patrick Moore: Story of astronomy. London. MacDonald, 1972.
- Mars Software: Mars, Arc Media Inc., 1998.
- Expert Software Corporation: Redshift 2: The ultimate virtual observatory. Florida - USA. Expert Software Incorporation, 1997.
- Astronomy Software Student Edition: The Sky, Astronomy Software, 1999.
- Mars Software: The Sun and Moon. Arc Media Inc., 1998.
- Discovery Communications: Universe. Discovery Communications Inc.2000.
- Centre for Astrophysics and Supercomputing, Swinburne. University of Technology, Australia: Clear skies! Centre for Astrophysics and Supercomputing, 1998.
- Mars Software: Galaxy. Arc Media Inc., 1998.
- Expert Software: RedShift 3: Explore the Universe. Expert Software Incorporation, 1998.
- Discovery Channel School: Explore Your World Series: Space Exploration. Shloka Publications Pvt. Ltd., Mumbai, India, 2005.
- Vigyan Prasar: India in Space. Vigyan Prasar, New Delhi, India. 2004.
- Discovery Channel School: Explore Your World Series: Solar System. Shloka Publications Pvt. Ltd., Mumbai, 2005.
- Discovery Channel School: Explore Your World Series: Destination Mars. Shloka Publications Pvt. Ltd., Mumbai, India, 2005.
- Patrick Moore, Zdenek Pokorny & Jiri Grygar: Astro 2001: The wonders of the universe: An interactive voyage into space, New York, USA. D-Data Inc., 1997.
- DK Multimedia. : Eyewitness Encyclopedia of Space and the Universe. DK Multimedia, UK, 1996.
- University of Southern California, USA. http://www.usc.edu/programs/cet/resources/science/
- University of Colorado, USA. http://casa.colorado.edu/
- Bakersfield College, USA. http://online.bc.cc.ca.us/sea/astronomy/index.htm
- Swinburne University of Technology, Australia. http://astronomy.swin.edu.au/
- University of Western Sydney, Australia. http://www.gradschools.com/Program/NSW_Australia/Astronomy/213026.html
- Liverpool John Moores University, UK. http://www.ljmu.ac.uk/courses/cpd/67289.htm
- University of Manchester, UK. http://www.jodrellbank.manchester.ac.uk/distance/
- Open university, UK. http://www3.open.ac.uk/study/undergraduate/science/physics-and-astronomy/courses/
- Central Michigan University, USA. http://www.cel.cmich.edu/courses/course.html?course=AST+111
- University of Central Lancashire, UK. http://www.uclan.ac.uk/information/courses/bsc_hons_astronomy_distance_learning.php
- 34. Moche, D. l. (1993). Astronomy: A Self Teaching Guide (4th ed.).New York: John Wiley and Sons.
- Moore, P. (2003). Philip’s Atlas of the Universe, (New Revised ed.). London: Octopus Publishing Group.
- Percy, J. R. (Ed.). (1996). Astronomy Education: Current Developments and Future Coordination, Astronomical Society of the Pacific Conference Series Proceedings,
Vol. 89. - Percy, J. R., Gouguenheim, L. & McNally D. (Ed.). (1998). New Trends in Astronomy Teaching. Cambridge: Cambridge University Press.
- Pasacheff, J., Percy, J. (Ed.). (1990). The Teaching of Astronomy. Cambridge: Cambridge University Press.
- Pompea, S. M. (2000). Great Ideas for Teaching Astronomy (3rd ed.). London: Thomson Learning Publishers.
- Shu, F. H. (1982). The Physical Universe. Sausalito, California: University Science Books.
- www.jpl.nasa.gov/multimedia (Jet Propulsion Laboratory, NASA)
- www.spacecenter.org/distancelearning.htm (NASA Education Center)
- www.hubblesite.org (Hubble Telescope)
- www.iucaa.ernet.in (Inter-University Centre for Astronomy and Astro-physics, Pune, India)
- www.esa.int (European Space Agency)
- Montgomery, D.C. (1992). Introduction to Statistical Quality Control, (2nd ed.). Brisbane: John Wiley & Sons.
- Everitt, B.S. (1998). The Cambridge Dictionary of Statistics. Cambridge: Cambridge University Press.
- Best, J. W. & Kahn, J. (2004). Research in Education. (7th ed.). New Delhi: Prentice Hall of India.
- Kothari, C. R. (2008). Research Methodology—Methods and Techniques. New Delhi: New Age International (P) Ltd.
About the Authors:
| Shri G. P. Pimpale is a lecturer in Physics working in the HPT Arts and RYK Science College, Nasik, Maharashtra, India for the last 27 years. The college is affiliated to the Pune University. Shri Pimpale did his M. Sc. (Physics) in 1981 and M. Phil. (Physics) in 1990 from the Pune University. He has successfully completed 2 minor research projects. Astronomy and Astrophysics are the areas of special interest for him and therefore he is a regular visitor to the Inter-University Centre for Astronomy and Astrophysics (IUCAA), Pune, India. Shri Pimpale has participated in 4 international and 15 national level conferences and has authored 2 books on Astronomy and has co-authored 1 book on Physics. He is a popularizer of Astronomy and has delivered number of lectures on various topics in that area. His students have excelled in the International Astronomy Olympiad and have bagged gold medals. Postal address – Maitra, Plot No. 52, Gulmohar-vihar Colony, Pipeline Road, Satpur, Nasik 422 007, Maharashtra, India. Phone: 0253 2351066, Mobile No.: 9423965686. E mail: gpimpale@gmail.com. |
Rajendra V. Vadnere is Director, School of Continuing Education, Yashwantrao Chavan Maharashtra Open University, Nashik, Maharashtra, India. He has completed his Ph.D. in Physics from the prestigious Indian Institute of Technology, Mumbai. His present research interests are e-learning and its applications in open and distance education systems. Email: raj_vad@yahoo.com or ce@ycmou.com |
G. P. Pimpale and R. V. Vadnere
1. Department of Physics, H.P.T. Arts and R.Y.K. Science College,
Nasik 422005, Maharashtra, India.
E-mail: gpimpale@gmail.com.
2. School of Continuing Education, Y.C. M. Open University,
Nasik, 422222, Maharashtra, India.
E-mail: raj.vad@gmail.com.
